maps
1— ‡ —2— ‡ —3— ‡ —4— ‡ —5
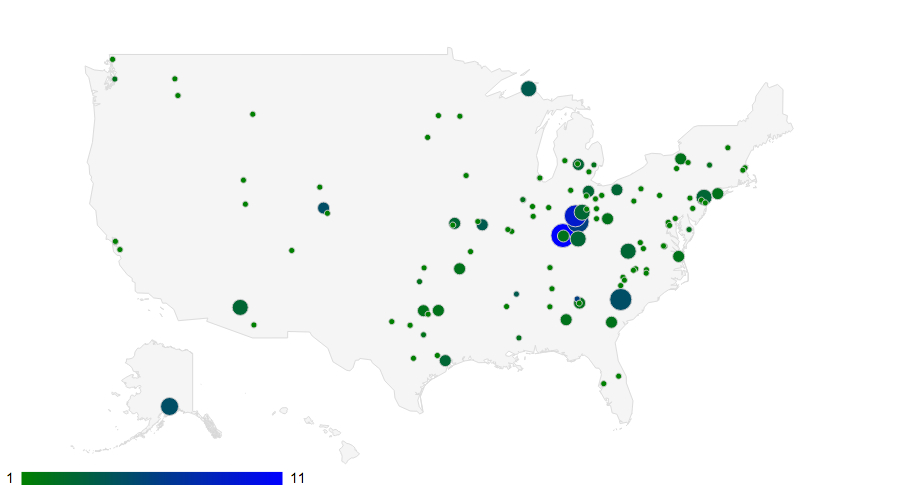
participating institutions by number of participating years and number of pariticpants
The following map plots data points for 117 home institutions and may take a minute
to load. The circle size corresponds to the number of years that a
home institution has sent participants to DMAC, and the circle color corresponds to
the number of participants that a home institution has sent to DMAC (see the color
key). Hover over data points for more information (dense clusters reveal a magnified
view). For the most part,
the number of years and number of participants maintain a somewhat linear relationship,
indicating that home institutions prefer to send one or two people at a time to DMAC.
Funding
presents the most obvious explanation for this pattern with a notable exception at
Kennesaw State University, which sent 6 participants to the 2006 DMAC Institute. The
relationship
between years and numbers of attendance also suggests the pace of institutional change
with respect to the integration of digital media amd multimodal composition in broader
departmental
contexts. In other words, incremental attendance may indicate institutional support
for individual initiatives, while large-scale attendance may indicate institutional
or administrative initiatives.
Kennesaw State's 6-person cohort, for example, was arranged by their Director of Composition,
and the University of Louisville's 4-person cohort in 2014 was arranged by their own
Director of Composition (as part of an initiative to develop an
online publication venue for undergraduate work).
circle size: number of participating years | circle color: number of participants
Click here to download a static image of this mapThe Ohio State University (67 participants, 9 years) has been excluded from this data
set to avoid
an unbalanced scale. The American University of Cairo (1 participant, 1 year) has
also been excluded because
the map features only one region: in this case, the United States. One participant
is not included
due to a lack of institutional affiliation at the time of DMAC attendance.